Pep Talk about broker of choice and best propfirm to use as we dive into the intricacies of trading$$$…


Before we indulge in these SMC/Price Action tutorials its a pleasure to have you abroad, already assuming you have connected you trading account to mt5/4 or another trading platform, as for the trading broker of choice would recommend you to use this broker with a leverage range of a maximum of 1:3000 and offers deposit bonuses of 50% for every deposit you make allowing you to start with a higher trading equity, to sign up CLICK HERE .
For those who have more questions or are looking for something else feel free to reach me on Whatsapp +263784542662 or email dellah@smcpips.com.
For youtube tutorials click here
PRICE ACTION
Price action trading is a methodology for financial market speculation which consists of the analysis of basic price movement across time. It’s used by many retail traders and often by institutional traders and hedge fund managers to make predictions on the future direction of the price of a security or financial market.Put simply, price action is how price changes, i.e., the ‘action’ of price. It’s most easily observed in markets with high liquidity and volatility, but really anything that is bought or sold in a free market will generate price action.
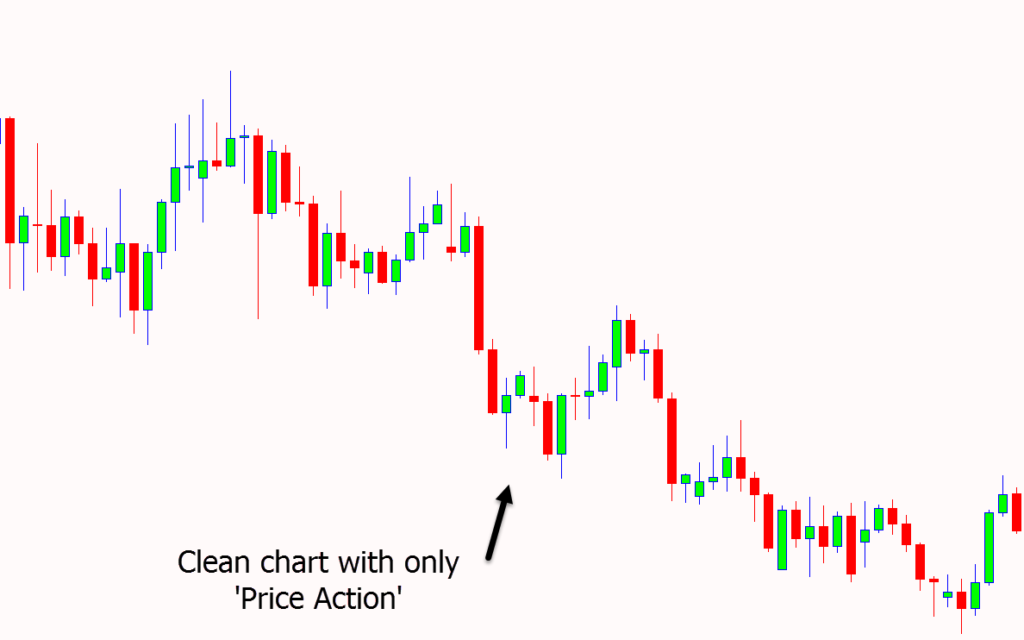
Price action tends to move in 3 trends thats is upward trend, downtrend and sideways/ranging
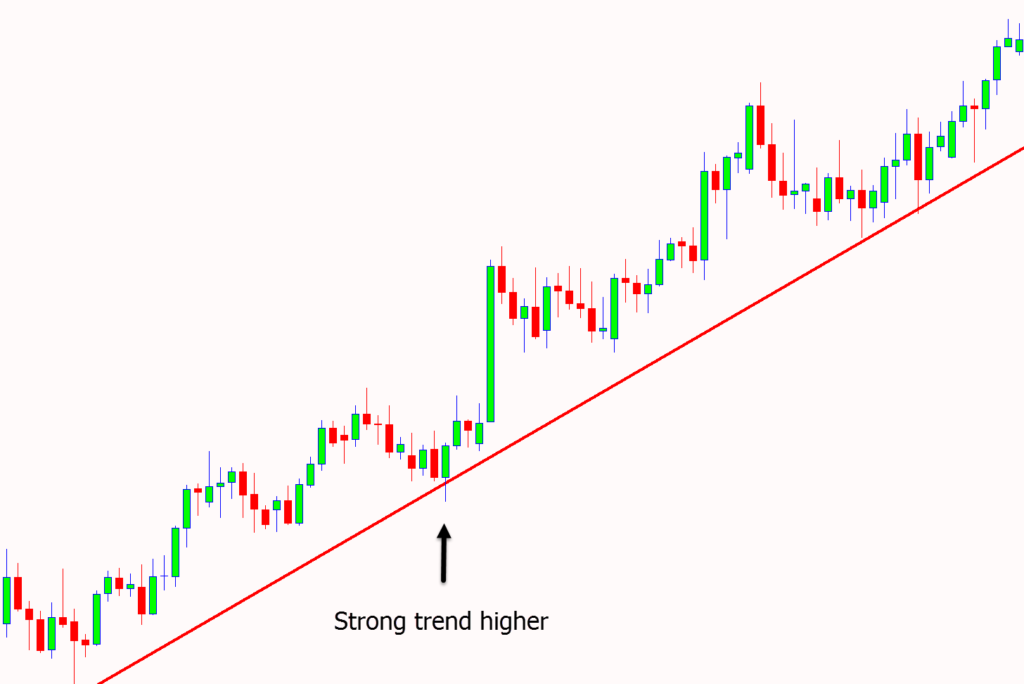
the picture above is showing an uptrend as you can see the general market direction for the trend is going upwards hence it is an uptrend. An upward trendline has a positive slope and two or more low points. The second low must be higher than the first for the line to have a positive slope. This line is considered to be valid when there are at least three (3) data points connected above each other.
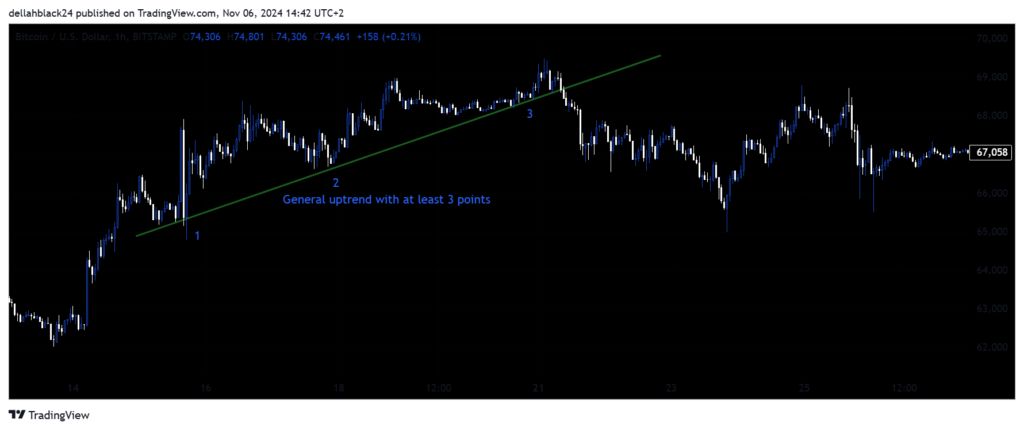
The upward trendline acts as a support for the price and the bullishness remains as long as the price stays above the up trendline. A downward trendline has a negative slope and two or more low points. The second low must be lower than the first for the line to have a negative slope. This line is considered to be valid when there are at least three (3) data points connected above each other.

The downward trendline acts as a resistance for the price and the bullishness remains as long as the price stays below the down trendline.
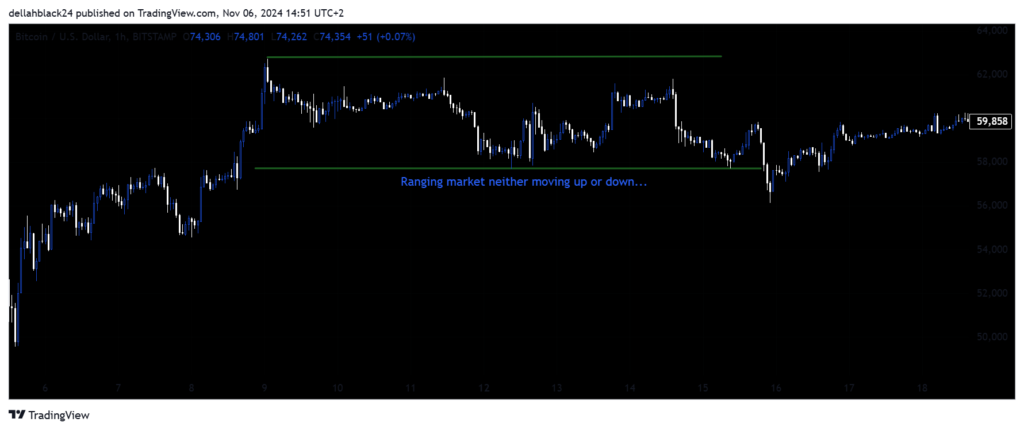
Ranging market has no overall market direction as price will be consolidating between a previous high and low resulting in a sideway market movement.
NB ALWAYS BUY AT THE LOWEST POINT BEFORE AN CONTINUATION IN AN UPTREND AND ALWAYS SELL AT THE HIGHETS POINT BEFORE A CONTINUATION IN A DOWNTREND
Next is the study of the confluences which allow us to determine our trade entries buckle up……………..
Break of Structure (BoS)
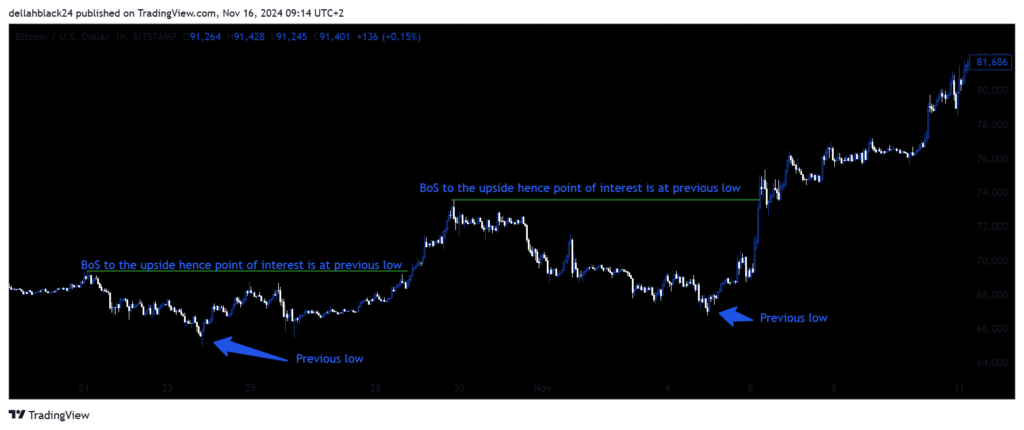
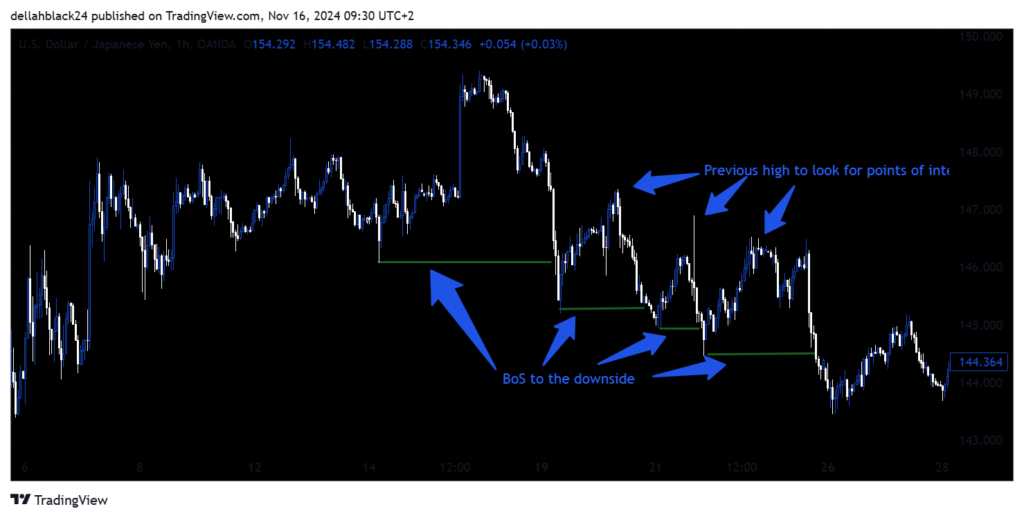
During an uptrend a break of structure occurs when a previous high is taken out forming a new high. Upon noticing the formation of a break of structure the key note is to look for Orderblocks, fairvalue gaps/Imbalances, liquidity zones at the previous low as these will be our points of interest once price retraces to mitigate these zones before continuing with the uptrend. same goes for a downtrend.
Supply and Demand zones
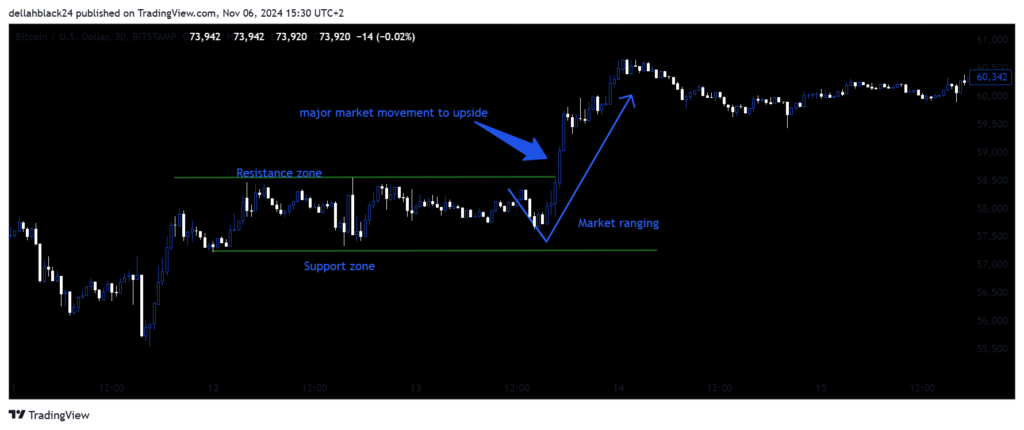
Supply-demand is nothing but the border area of support or resistance. Price will be ranging between these borders. Support is a price level at which a currency pair tends to stop falling and may reverse direction. It represents a point where buying interest is strong enough to overcome selling pressure. Resistance is a price level at which a currency pair tends to stop rising and may reverse direction. It indicates a point where selling interest is strong enough to overcome buying pressure. Two steps to identify the supply and demand zones. 1) Establish the base (usually sideways price action area) from which the price started the quick move. 2) Look at the chart and try to spot large successive candles. It is important that the price moves a lot. The picture below shows a demand zone where buyers gained momentum and broke out of the range with impulsive moves.
Supply zone is illustrated in the diagram below
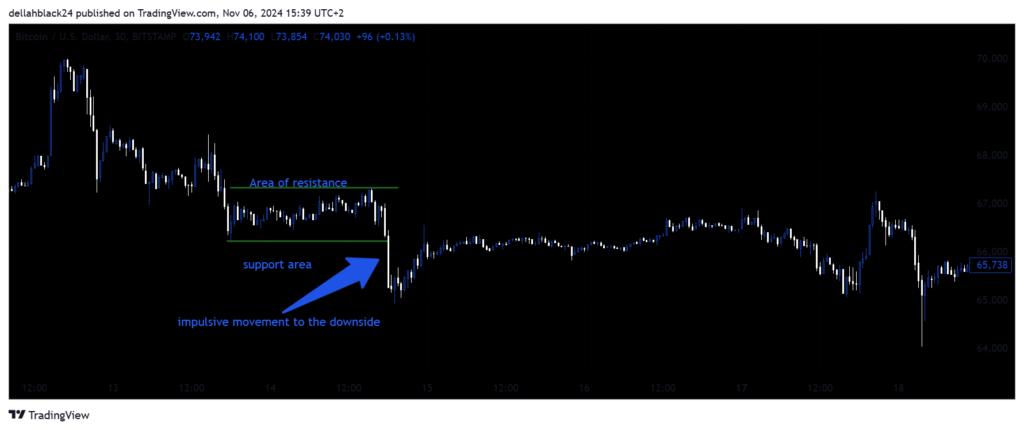
Impulsive movement is characteried by 2 or more long candles showing high buying or selling power
Order Blocks are key components of smart money trading. An Order Block represents a
change in the state of price delivery where big participants and banks leave their orders in
the form of sell or buy limits. There are two types of order blocks in forex: bearish order
blocks and bullish order blocks. The bearish order block is the last up candle that forms a high before an aggressive downward move, while the bullish order block is the last down candle that forms a low before an aggressive upward move. To identify order blocks, traders look for:
- Clusters of Candlesticks: A series of candlesticks with consistent high volume.
- Volume Spikes: Unusually high trading volume in a specific area.
- Price Consolidation: A period where the price moves sideways within a tight range before a breakout.
Order blocks can act as strong support or resistance levels. When the price revisits these zones, it often reacts strongly, providing potential entry or exit points for traders.
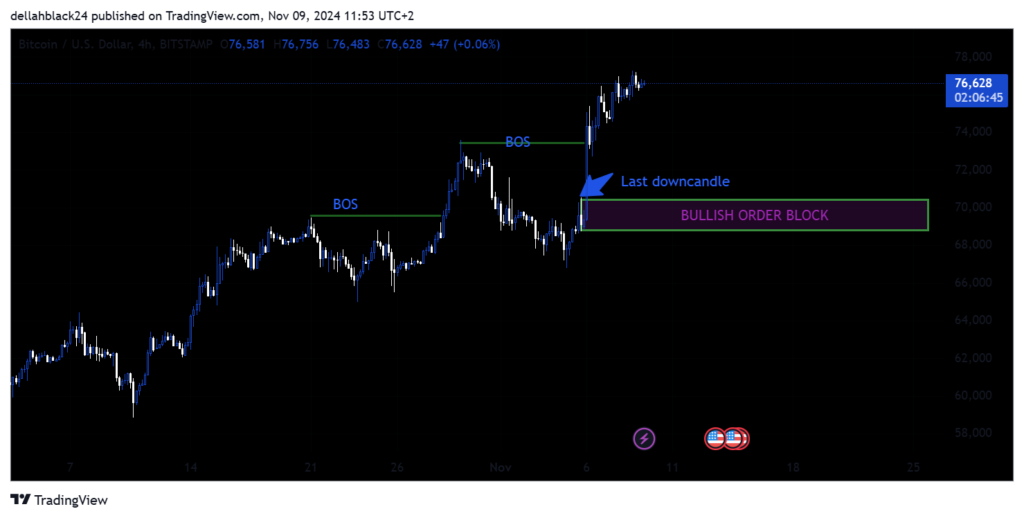
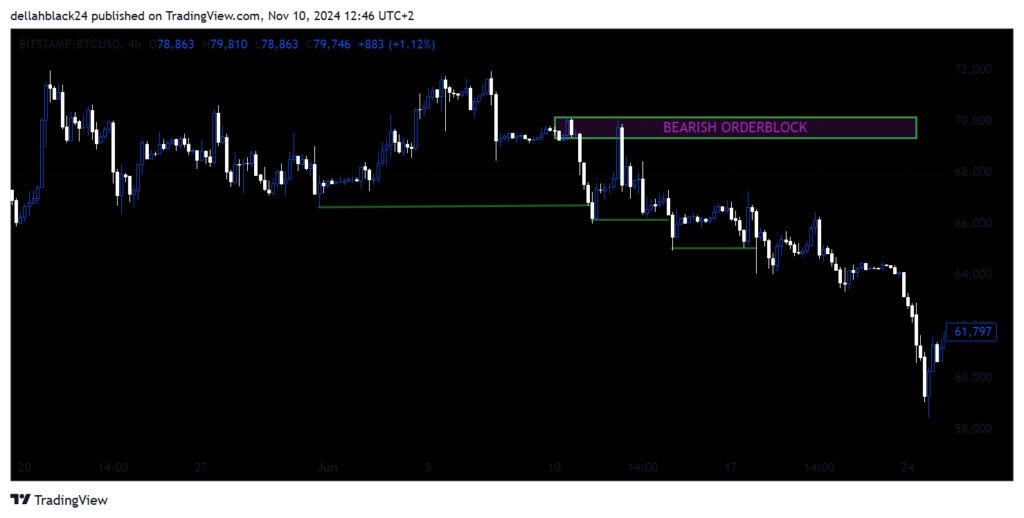
Break of Structure (BOS) is when market structure if in an uptrend surpasses the previous high going for a higher one. The opposite is true also for a downtrend whereby market surpasses previous low aiming for a lower low. After every BOS order blocks are left behind which act as our point of interests
TO BE UPDATED KEEP ON CHECKING EVERYDAY THANK YOU FOR YOUR PATIENCE
